 Core-Monitor
The instrument panel your Mac never shipped with.
Core-Monitor reads temperature, CPU and GPU load, power draw, memory, battery and fan speed from the sensors already inside your Apple Silicon Mac, and shows them in one native window and the menu bar. No account, no telemetry, and fan control only when you ask for it.

Every subsystem gets its own screen
History sits behind each number, and the menu bar carries a short version, so the window can stay closed most of the day.
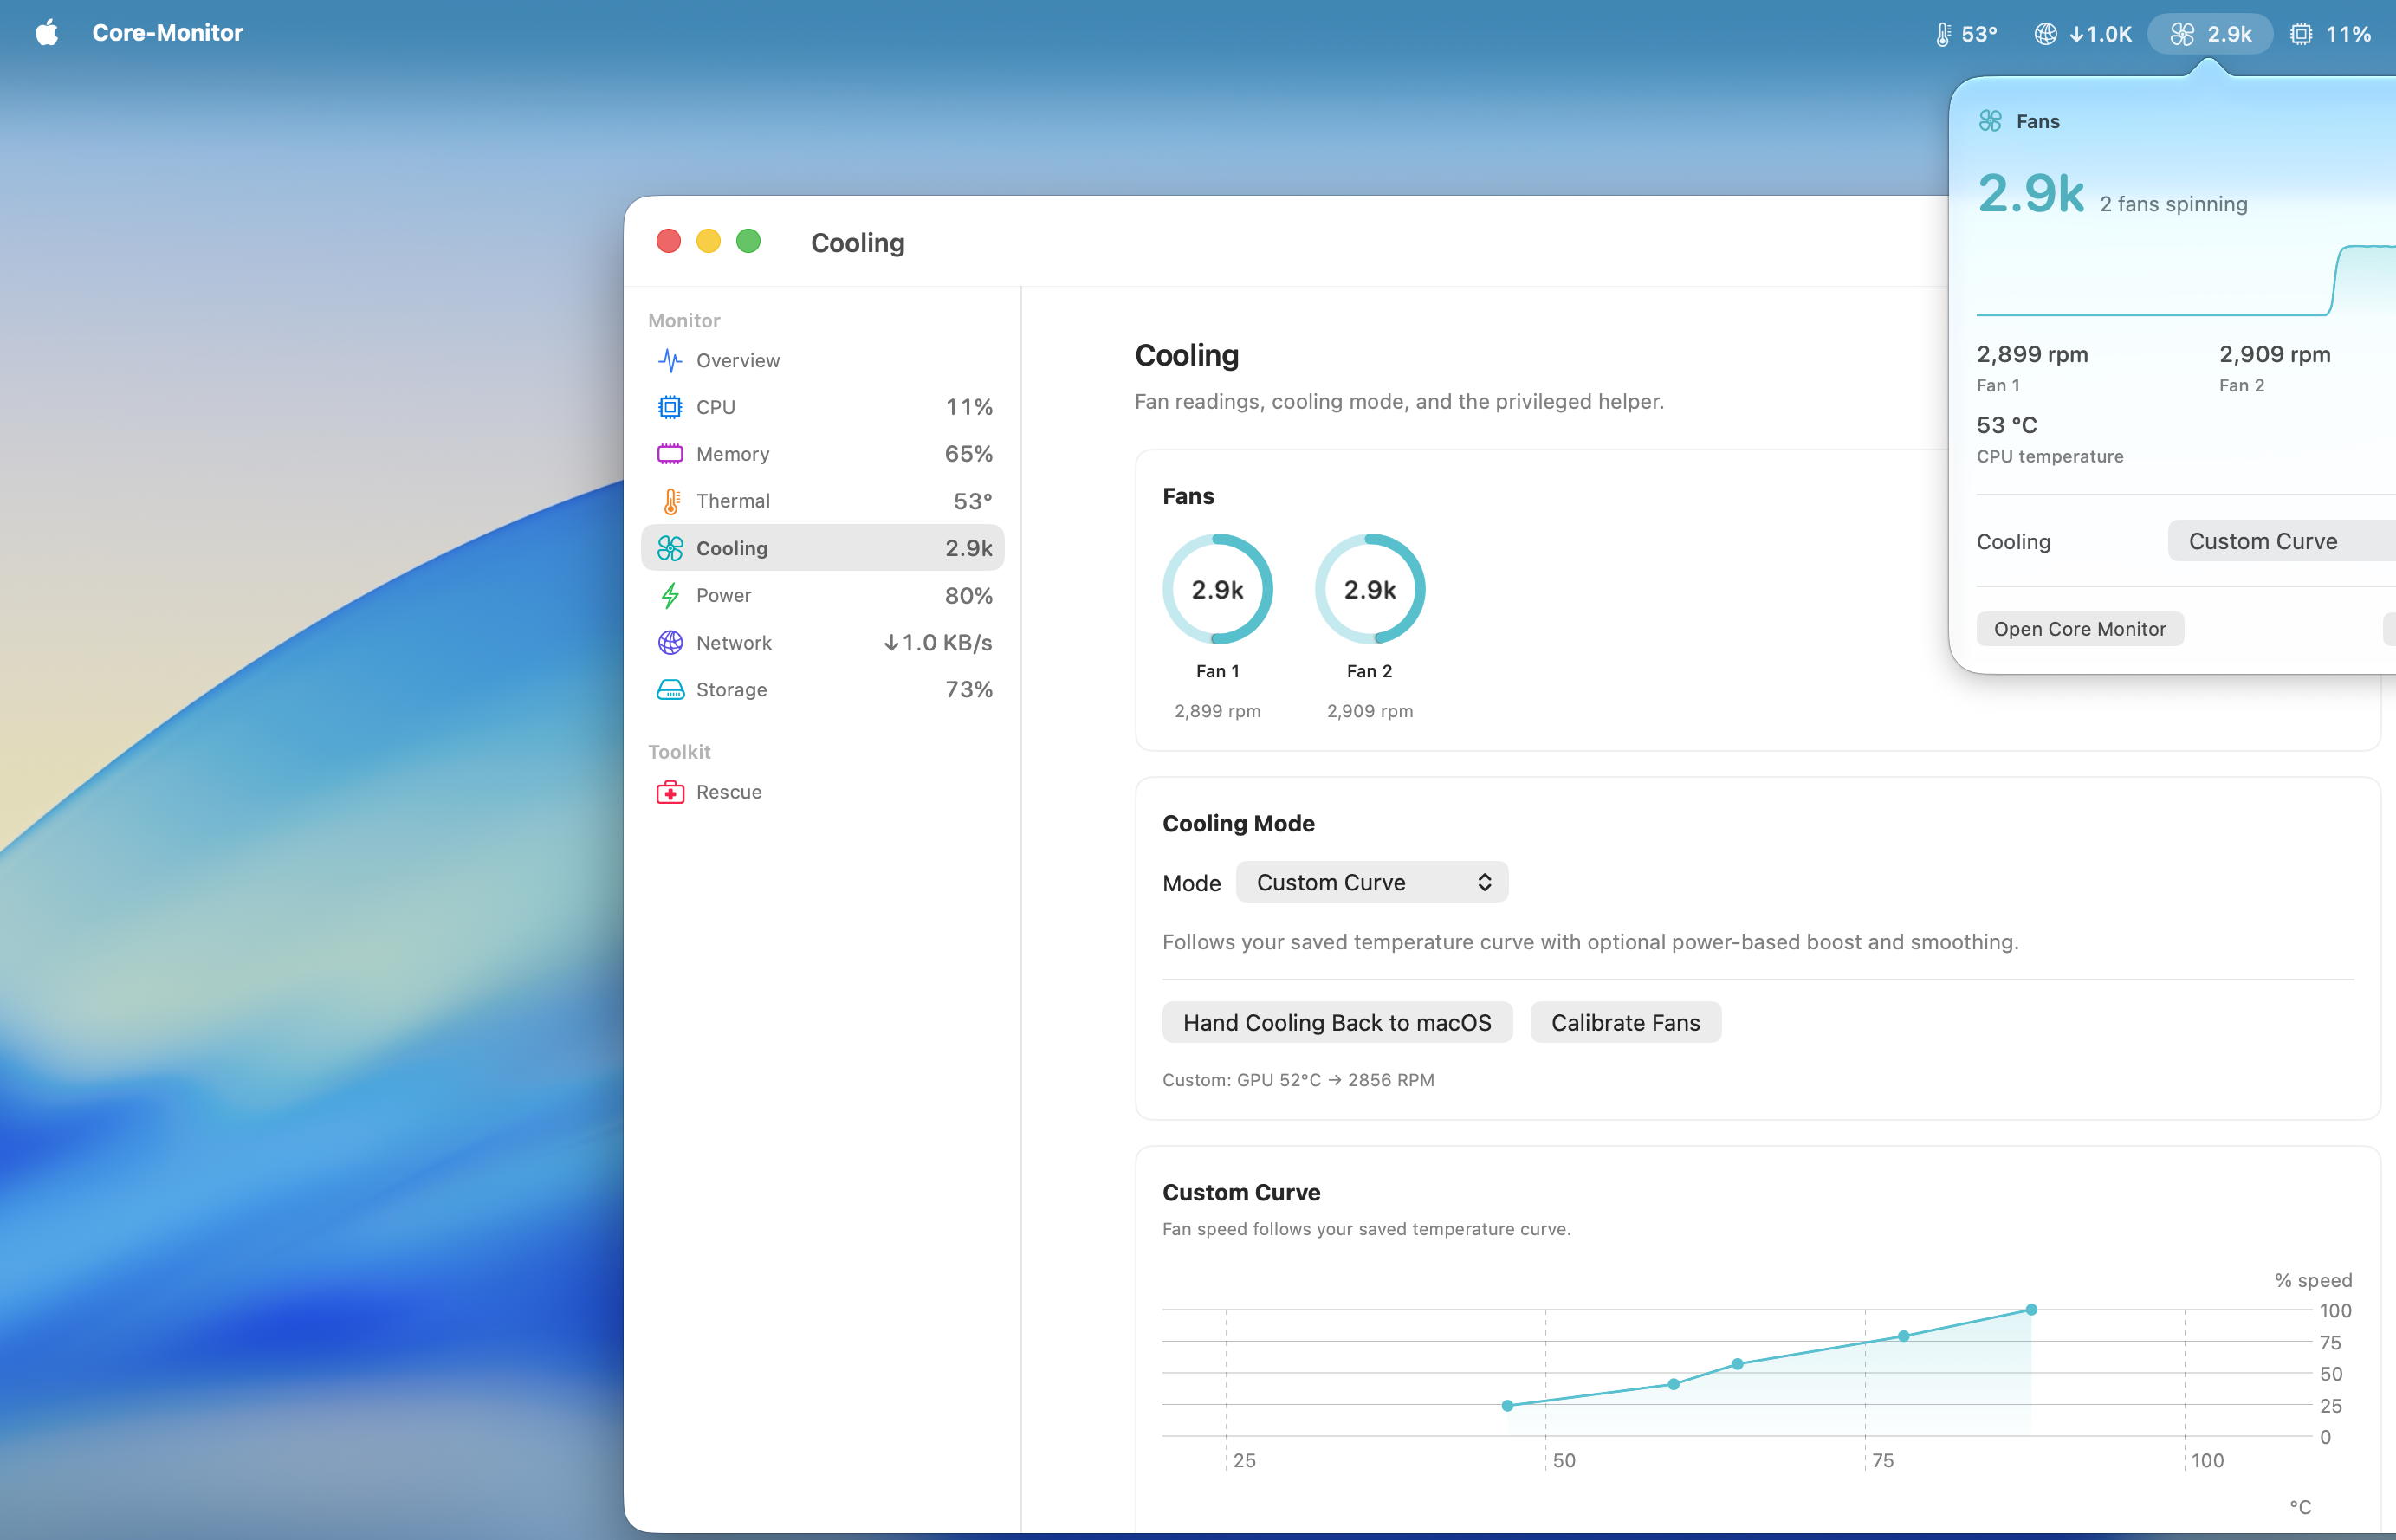
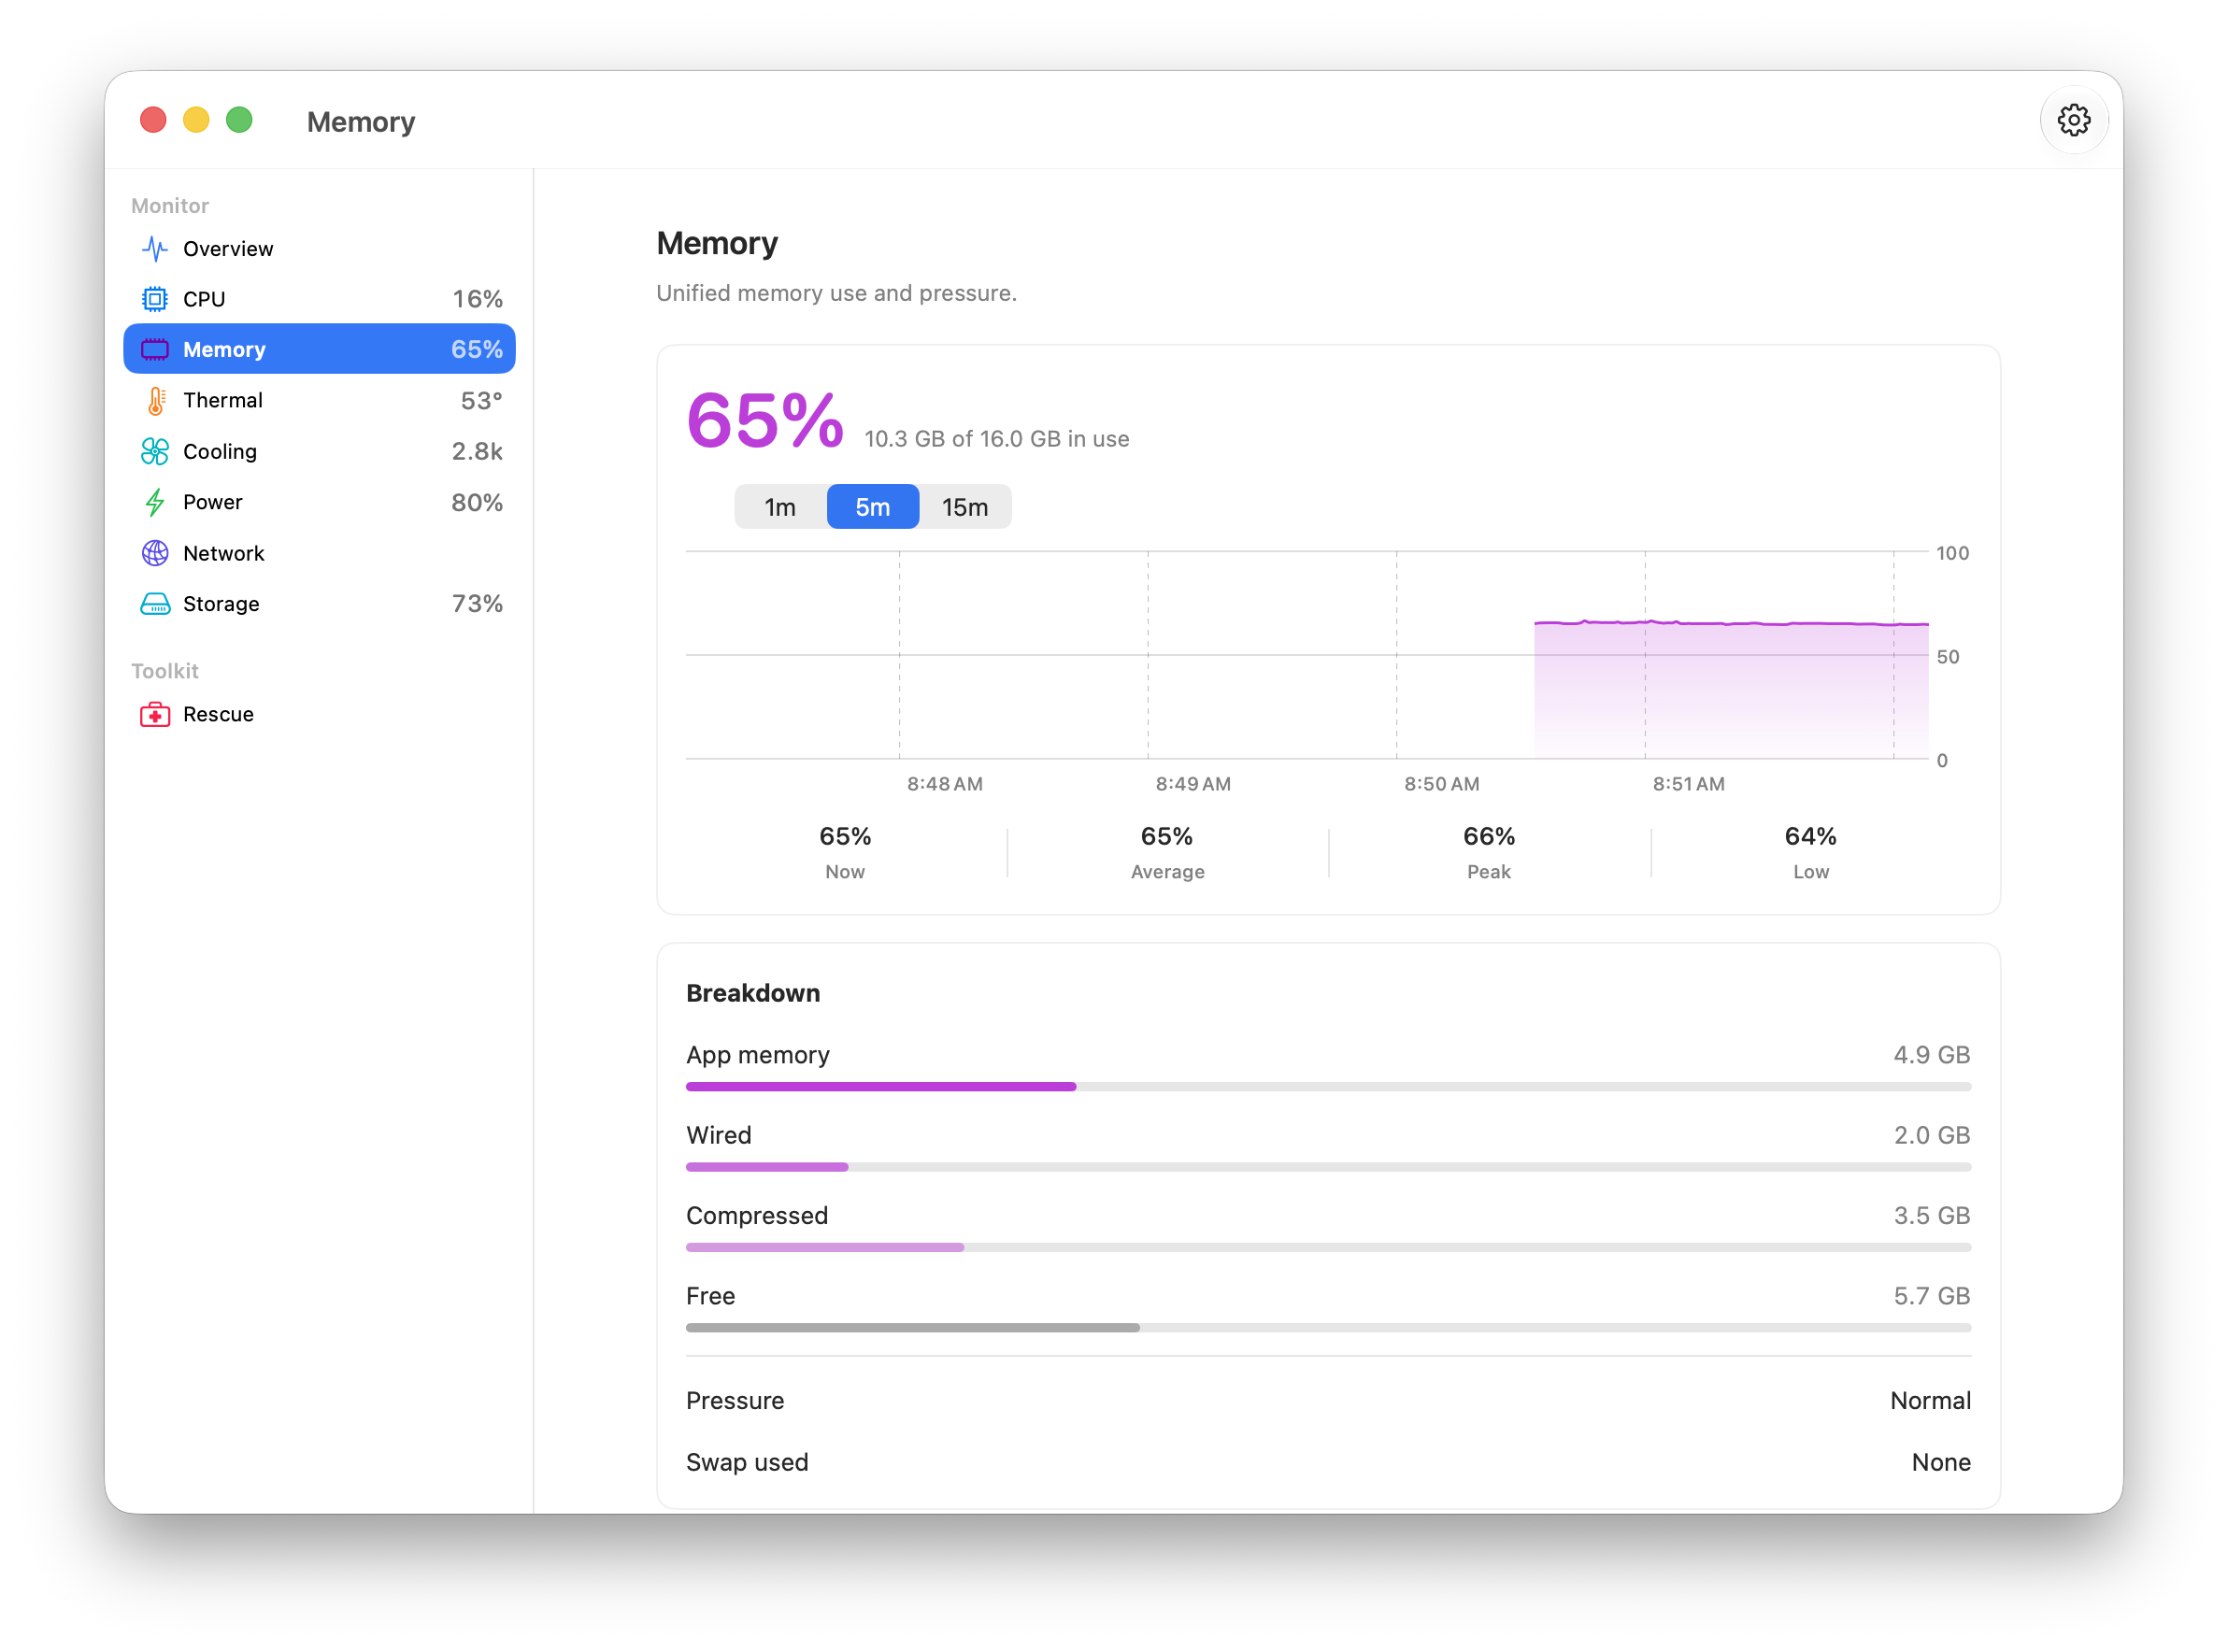
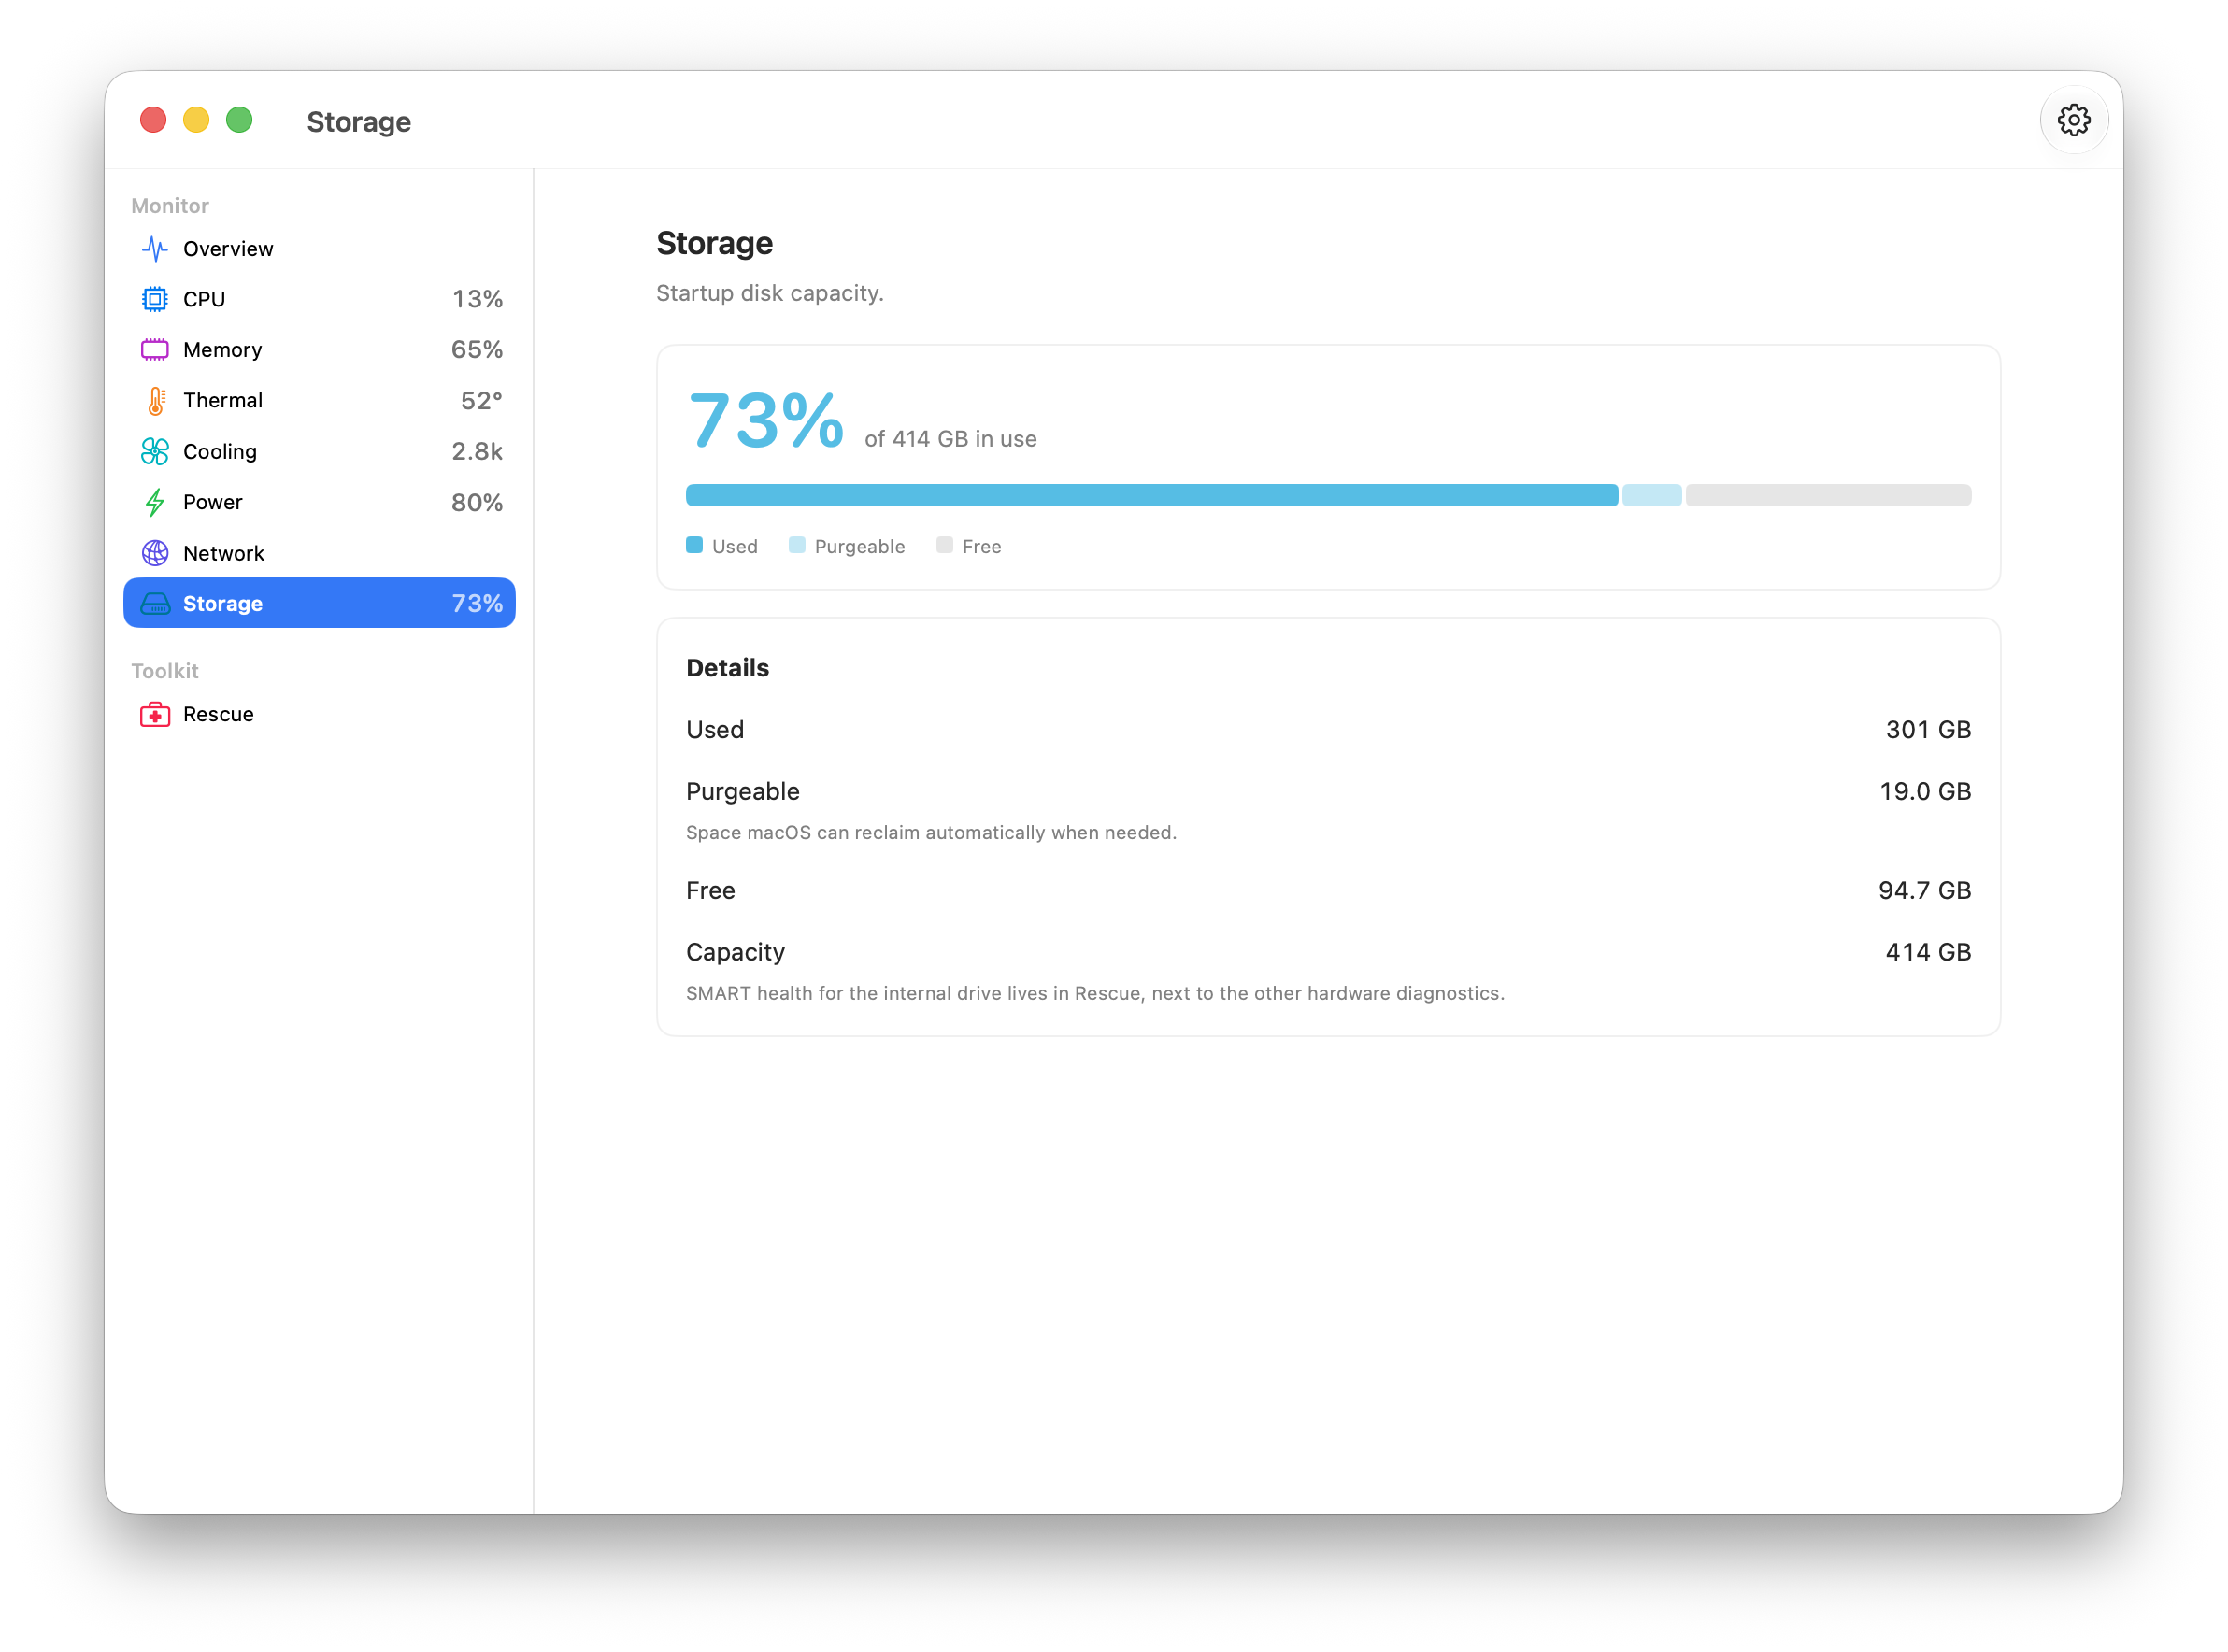
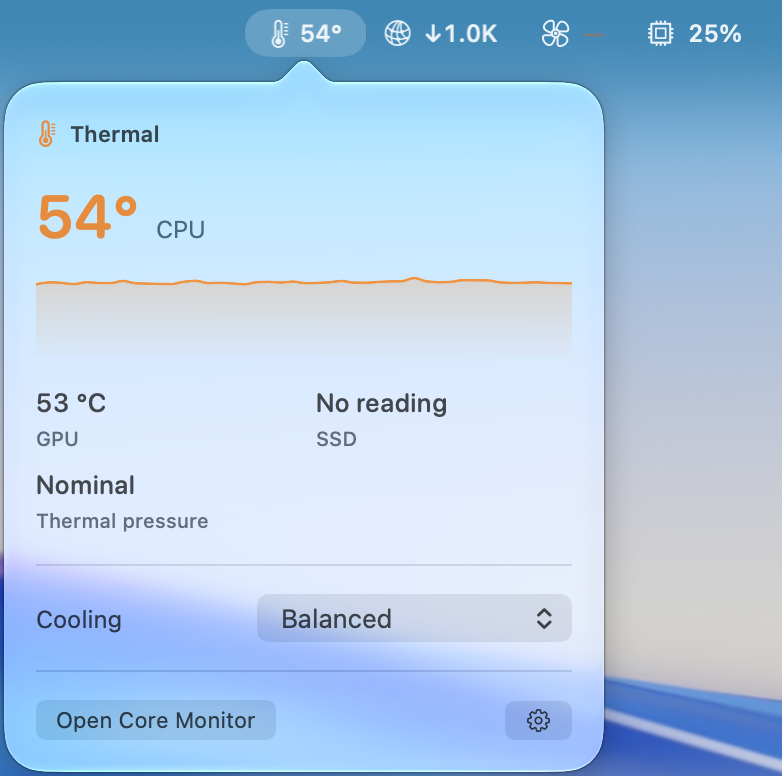
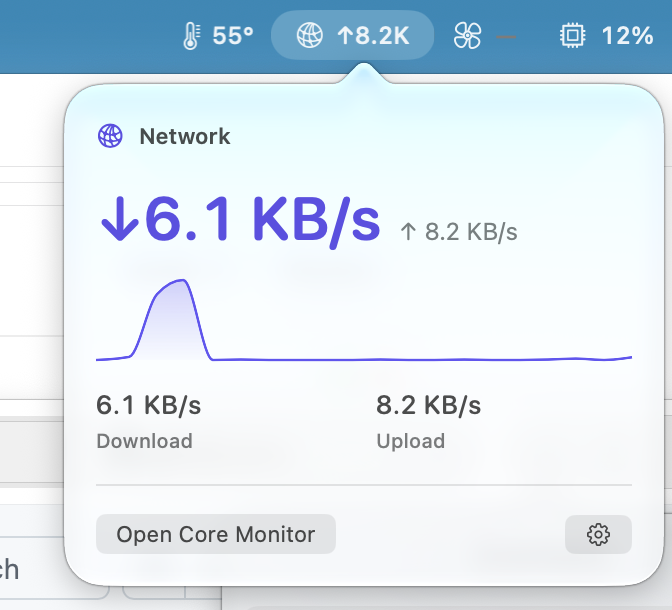
scroll sideways for more — each tile opens the full-size capture
Read-only, until you decide otherwise
Out of the box, Core-Monitor only watches the fans. Install the optional helper and you get three ways to drive them: a fixed speed, a boost profile, or a curve you draw yourself, point by point.
- Hand it back anytime
- One button returns full control to macOS, no restart needed.
- Draw your own curve
- Map CPU or GPU temperature to fan speed across as many points as you want.
- Skip the helper entirely
- Monitoring works identically whether or not it is installed.
- Calibrate first
- Measure each fan’s real minimum and maximum before trusting a profile to it.
a custom curve · current operating point at 72°, about 2,900 rpm
Where people actually reach for it
The moments this was made around: the fans wind up and you want to know exactly why.
-
Compiling and exporting
Watch clock speed and heat while a long build or render runs, and see whether a slowdown is thermal or something else entirely.
-
Away from the charger
Watts in and watts out, so the time-remaining figure reflects what the Mac is actually drawing right now, not a rough guess.
-
Recording and calls
Pin the fans low before you hit record, check the temperature margin, then hand cooling back to macOS once you are done.
-
Warnings that stay put
Set a threshold for heat, memory or battery and get a notification straight from the Mac itself, with no server involved.
-
Nothing hidden
The full source is public, so anyone can check exactly what gets read, what the helper writes, and what never leaves the machine.
-
No account needed
No sign-in, no subscription, and no analytics library anywhere in the binary. Process names can be hidden in memory views too.
The Touch Bar, put back to work
On Macs that still have one, Core-Monitor turns the Touch Bar into a strip of live instruments that sits above whatever app has focus.
Widgets, overlays and shortcuts
Stats, optional live weather, shortcuts and memory pressure, arranged with a live width preview so a layout never runs off the edge of the strip. The strip holds its place across apps, so you can check a reading or launch something without switching windows. Live weather stays off until you enable it.
Readings stay on the machine that made them.
Core-Monitor reads your system, then keeps that data on your Mac. There is no account to create and no telemetry to switch off.
Live Weather is off by default. If you enable it, Apple WeatherKit receives your location after you grant permission. Read the source code and check for yourself.
- monitoring data sent
- none
- accounts required
- none
- analytics libraries
- none
- source code
- public, GPL-licensed
- weather requests
- only after opt-in
How it stacks up
A handful of good Mac monitors already exist. This is where Core-Monitor sits next to them, stated plainly.
| App | Strong at | Where Core-Monitor differs |
|---|---|---|
| iStat Menus | Covers dozens of metrics across many menu bar modules. | Narrower on purpose. Heat, power and fans, open source, with no license to buy. |
| TG Pro | Deep per-sensor diagnostics. | Monitoring comes first here; writing fan speed is an optional layer, not the whole app. |
| Macs Fan Control | Direct control over fan speed. | Wraps that control in a full dashboard, with history, alerts and menu bar readouts. |
| Stats | Free, modular menu bar widgets. | One dedicated window with history, built specifically around thermals. |
Two editions, three ways in
Pick whichever matches how you manage software on your Mac. Every route below is free.
Download the signed build
Install through Homebrew
Add the tap once, then install and upgrade the cask the same way you handle everything else.
brew tap --custom-remote offyotto/core-monitor \
  https://github.com/offyotto/Core-Monitor
brew install --cask offyotto/core-monitor/core-monitor
Take the sandboxed edition
Core-Monitor is available free on the Mac App Store as a read-only build reviewed and delivered by Apple. It has no helper and no fan writes.
Questions before you install
Short, direct answers to what people usually check first.
Which Macs can run it?
Apple Silicon Macs on macOS 13 or later. The sensors and fan interfaces it reads are specific to Apple’s own chips, so Intel Macs are not supported.
Do I need the helper installed?
No. Every reading works without it. It exists only so the app can write fan speeds, and you can hand control back to macOS whenever you like.
Does it phone home?
Core-Monitor has no account, advertising, or analytics, and it does not send monitoring data to the developer. Live Weather is off by default. If you explicitly enable it, the app asks macOS for location access and requests weather from Apple WeatherKit. Turning it off stops Core-Monitor’s weather requests; macOS and App Store components may still make their own connections to Apple services.
Can fan control damage my Mac?
macOS keeps its own thermal limits regardless of what any app requests. Core-Monitor also keeps an obvious way out: one click gives full control back to the system.
What is deliberately left out?
Cloud dashboards, fleet management, and a metric for every corner of the OS. The scope stays heat, power, memory, battery and fans, done properly.
Where do bug reports go?
Open an issue on the GitHub tracker. Release notes and older builds live on the releases page.